What is an energy simulation? Explained with a worked example
An energy simulation calculates per quarter hour whether a battery, solar panels or chargers fit within your grid connection. With a worked example.
An energy simulation calculates, quarter hour by quarter hour, how the consumption, generation, storage and grid connection of a business behave over a whole year, even for a situation that does not exist yet. So you see before investing whether a battery, solar panels or chargers fit within the contracted transport capacity, and what they deliver.
What an energy simulation is
An energy simulation is a model that replays how an energy system behaves over time. You enter what is there now and what is being added. For every time step, the model calculates how much electricity is imported, generated, stored and exported. The result is not an annual total but a year of quarter hours, in which you see exactly when things get tight.
What sets it apart from a standalone calculation is that the parts affect each other. A battery charges on the midday solar surplus. The chargers draw power just as the sun goes down. And the connection limits everything at once. That interplay decides the outcome, and you only see it when you calculate step by step.
Two kinds of energy simulation
Search for energy simulation and you find two fields under one name. One is about buildings, the other about the energy system behind the meter.
| Building simulation | Energy system simulation | |
|---|---|---|
| The question | How much heating and cooling does a building need? | Does what I want fit within my grid connection, and what does it deliver? |
| Works with | Building physics, insulation, ventilation and the weather | The connection's 15-minute data, generation, storage, charge points and contracts |
| Typical outcome | Heat loss, comfort, the size of a heat pump | Peaks, transport capacity exceedances, the size of a battery, costs per scenario |
| Well-known software | EnergyPlus, Vabi, TRNSYS | Simulation software for energy systems, such as Wattix |
| Who uses it | Building physicists, architects and building services engineers | Installers, energy consultants and energy partners |
This article is about the second kind. That is where most of the questions come from now, because the grid is full in large parts of the Netherlands. A business that wants to become more sustainable or to grow needs to know first what fits within its existing connection. More on that situation under grid congestion.
Why annual totals are not enough
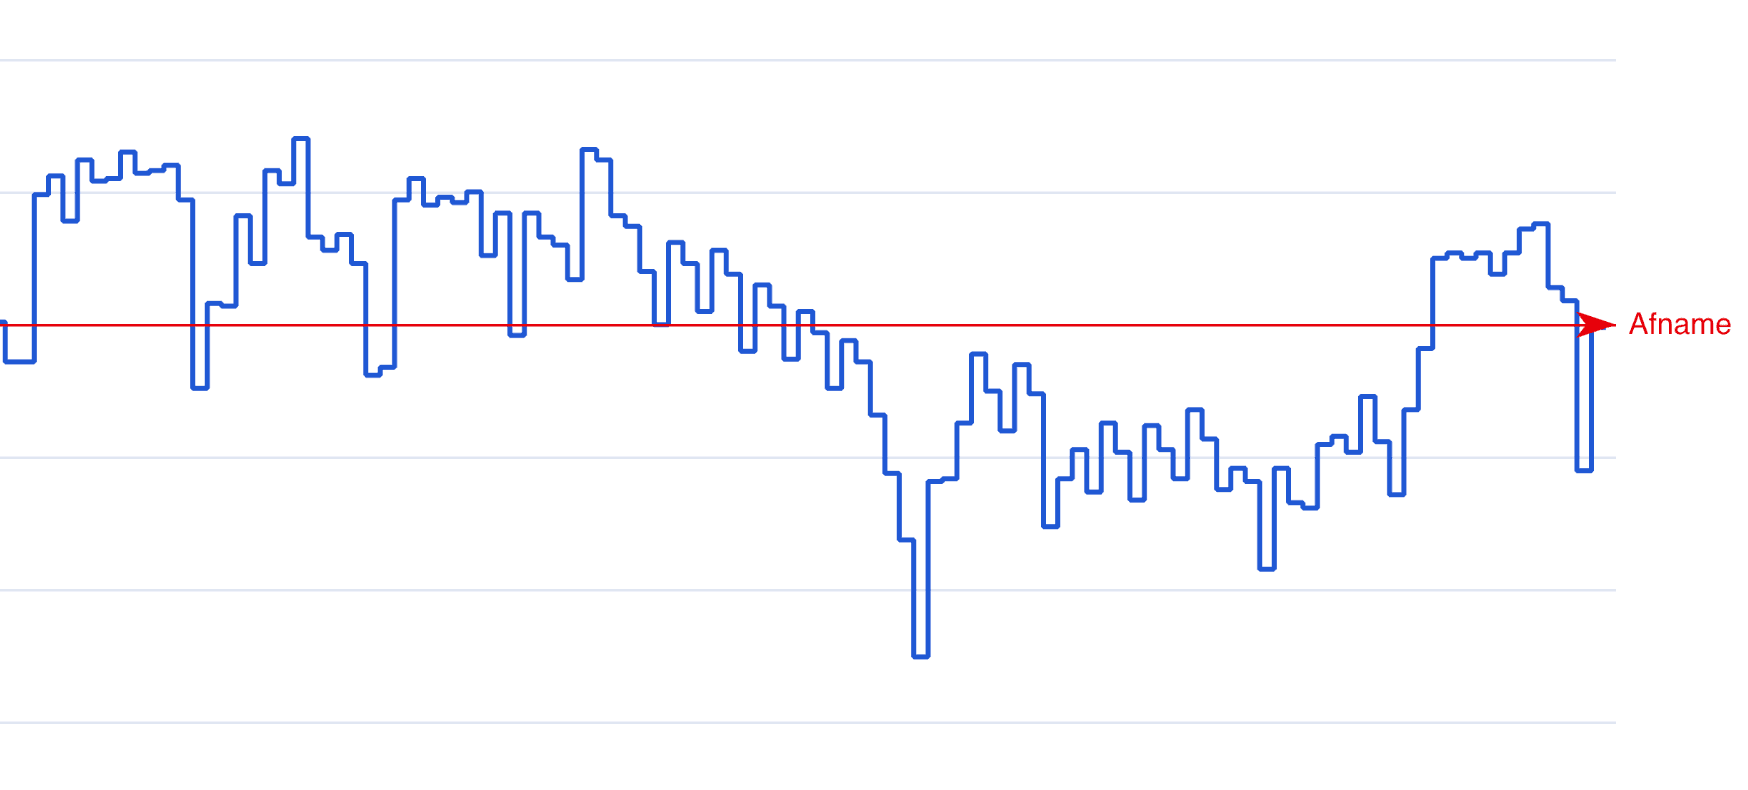
The transport company in the worked example below uses 2,316 MWh a year with 20 electric trucks. That is 264 kW on average, well below the 400 kW the grid operator can offer. Yet it does not fit. The trucks charge mostly at night, and then the depot needs almost 600 kW on average. Within 400 kW the trucks get only two thirds of the electricity they need, on every working day.
With individual peaks the gap is even bigger, because they are short and rare. A year has 35,040 quarter hours. A few exceedances a month disappear in any annual or monthly total, and an hourly average spreads a 15-minute peak over the whole hour. The grid operator measures a large business connection per quarter hour. That is why an energy simulation calculates at the same resolution.
What you put in
- The connection's 15-minute data. The measured consumption per quarter hour, preferably for a whole year, so it covers every season.
- What is being added. Profiles for solar panels, charge points, a heat pump or a new hall. If there is no metering data yet, you draw the expected consumption per quarter hour in the Data Studio.
- The limits of the connection. The contracted transport capacity for import and export, and if there is one, a capacity contract with a different limit per hour.
- The properties of the assets. For a battery the power, the capacity, the efficiency and the charging limits. For solar panels the installed capacity.
- Prices and tariffs. Fixed or dynamic energy prices and the grid tariffs, so you can compare scenarios in euros.
What comes out
- The new peak power, and on how many days and by how much energy the transport capacity is exceeded.
- The size of a battery that absorbs those peaks, in kW and kWh. This is how battery sizing for peak shaving works.
- How much solar power you use yourself and how much you export or have to curtail.
- The costs and returns per scenario, as input for the payback period.
- A report to go through with the client.
The value is mainly in the comparison. One scenario tells you whether something fits. Several scenarios side by side tell you which choice is best.

“Before, we couldn't really back up our recommendations with a proper business case. With Wattix we can calculate multiple scenarios, compare the results side by side, and let the customer decide.”
Worked example: a transport company with 400 kW of transport capacity
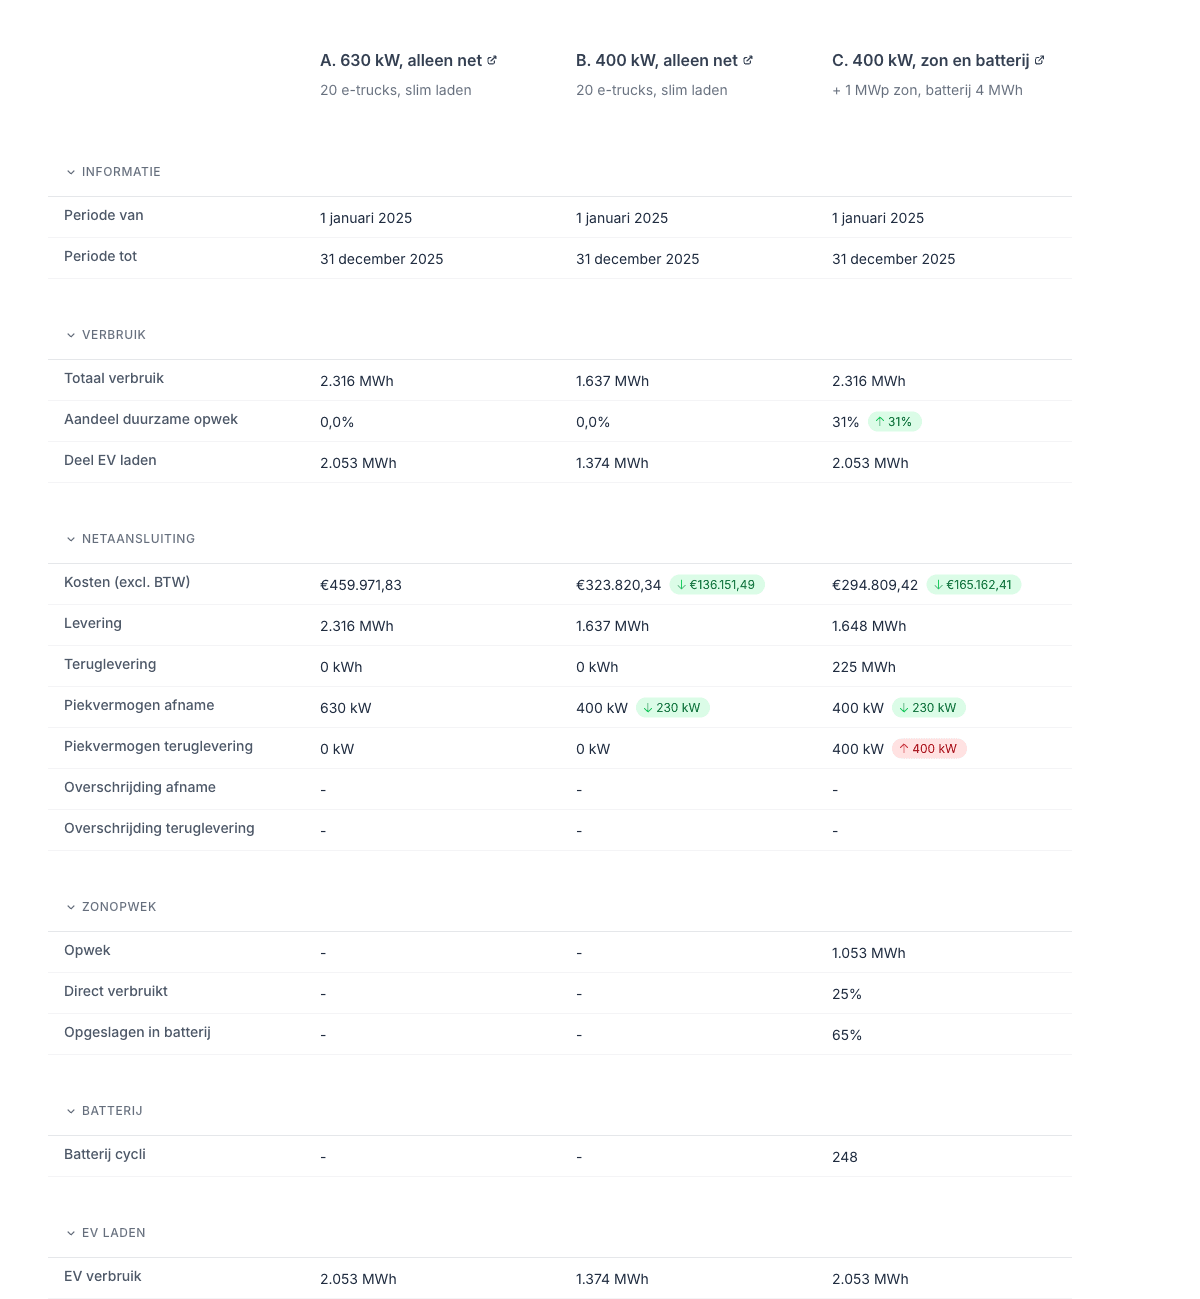
A transport company is switching to 20 electric trucks. On working days, every truck charges 375 kWh at a 150 kW charge point. Fourteen trucks charge at night between 17:00 and 6:00, six also top up around midday. The depot itself uses 30 kW. Charging is smart: the power is spread over the trucks and the hours, with dynamic energy prices for 2025. The trucks need a 630 kW connection, but because of grid congestion the grid operator cannot offer more than 400 kW. Can the company still go electric?
| A. 630 kW, grid only | B. 400 kW, grid only | C. 400 kW, solar and 2 MW / 4 MWh battery | |
|---|---|---|---|
| Highest quarter-hour import | 630 kW | 400 kW | 400 kW |
| Quarter hours above transport capacity | 0 | 0 | 0 |
| Charging energy for the trucks | 2,053 MWh | 1,374 MWh (67%) | 2,053 MWh |
| Working days with trucks not fully charged | 0 | every working day | 0 |
| Solar power used on site or stored | - | - | 90% |
| Costs per year (excl. VAT) | €459,972 | €323,820 | €294,809 |
Scenario B stays neatly within 400 kW and does not exceed the transport capacity in a single quarter hour. Yet it does not fit: a third of the charging energy is left undelivered, and on no working day do all the trucks leave fully charged. B only looks cheaper because less is charged.
Scenario C charges every truck fully within the same 400 kW. It adds 1 MWp of solar panels and a 2 MW / 4 MWh battery. The battery charges during the day on solar and grid power and passes it on to the trucks at night. A quarter of the solar power is used directly and almost two thirds goes into the battery. Costs are €165,000 a year lower than in A. That has to be weighed against the investment in solar panels and the battery, which sets the payback period.
The size of the battery follows from the same comparison. With 2 MWh the trucks get 92% of their charging energy, with 3 MWh 99%. Only with 4 MWh is every truck fully charged on every working day.
Energy simulation, digital twin and EMS
The three terms get mixed up in practice, but they answer different questions.
- An energy simulation tests choices before anything is bought or built. The answer is advice: what fits, and which option is best.
- A digital twin is a digital model of an existing system, kept up to date with live metering data. A simulation can run on a digital twin, but does not need one. A year of 15-minute data is enough for advice.
- An energy management system (EMS) controls the assets in real time, such as a battery or chargers. An EMS looks hours or days ahead. A simulation looks at a whole year and compares choices.
Many EMS suppliers offer their own simulation. That is convenient, but it assumes their own system. To choose the best EMS for each project, you need an independent calculation. To see how Wattix compares to a supplier that delivers simulation and EMS together, read the Tibo Energy alternative.

“With some providers you have to use their EMS and trust their simulation. We want to choose the best EMS per project. Wattix gives us that freedom.”
How accurate is an energy simulation?
A simulation is as good as the data and the assumptions that go into it. Three things matter most:
- The resolution. With monthly totals or hourly data you miss the peaks. The minimum is 15-minute data.
- The period. A year of data contains every season. With a few summer weeks you underestimate the winter peaks, and overestimate what solar panels deliver in winter.
- The assumptions about what is new. How many cars charge at the same time, and when does the new machine run? That is where most of the uncertainty is. By putting scenarios side by side, you see how sensitive the outcome is to those assumptions.
So a simulation does not predict the future to the quarter hour. It shows which choice stays within the limits, with how much margin, and what happens if an assumption turns out differently.
When do you need an energy simulation?
- Your client gets a notice from the grid operator that the contracted transport capacity was exceeded. See grid congestion.
- A battery has to absorb peaks or trade on energy prices. See battery storage.
- Chargers are being added for a fleet or a charging hub. See e-mobility.
- Solar panels generate more than the connection is allowed to export. See renewables.
- You are considering a time-block transport right or a capacity-limiting contract. See contracts.
- A municipality wants to know in broad terms how much capacity a group of businesses needs together. See energy simulation for local governments.
Spreadsheet or simulation software?
For one asset and one scenario, a spreadsheet works fine. It breaks down as soon as assets affect each other and you want to compare scenarios: a battery charging on the solar surplus while the chargers draw power, over 35,040 quarter hours, in six variants. Simulation software calculates that in minutes and records the assumptions, so a colleague or the client can follow the advice. Where exactly that line lies is covered in energy simulation in Excel or in Wattix.
Wattix is simulation software for exactly that question. An installer uses it to back up the quote for a battery or a charging hub, see energy simulation for installers. An energy consultant puts scenarios side by side for the client, see energy simulation for energy consultants. And a partner with dozens of sites models all of them the same way, see energy simulation for energy partners.
Frequently asked questions about energy simulation
What is an energy simulation?
A model that replays, quarter hour by quarter hour, how the consumption, generation, storage and grid connection of a site behave over a year. You see in advance whether a battery, solar panels or chargers fit and what they deliver.
What data do I need for an energy simulation?
The connection's 15-minute data, preferably for a whole year, as an Excel or CSV file. Plus the contracted transport capacity and the details of the assets you want to model.
Can I simulate without metering data?
Yes. For a new building or an extension you draw the expected consumption per quarter hour in the Data Studio. That profile is added to the measured data of the existing connection.
How accurate is an energy simulation?
As accurate as the data and the assumptions. With a year of 15-minute data you see the real peaks. The biggest uncertainty is in what is new, such as charging behavior, which is why you compare scenarios.
Is an energy simulation the same as a digital twin?
No. A digital twin follows an existing system with live data. A simulation tests choices before they are made. You don't need a digital twin to give advice.
What is the difference between an energy simulation and an EMS?
An EMS controls assets in real time. A simulation shows in advance which assets, what size and which contract fit. So you simulate before you choose an EMS.
How long does an energy simulation take?
Once the 15-minute data is loaded, a scenario in Wattix is ready within a few minutes. Most of the work is in collecting the data and choosing the scenarios.
Can I model several businesses together?
In broad terms, yes. You put the consumption and generation of the businesses together behind one connection and see how much capacity the group needs as a whole. It gives a first picture, for a municipality for example, not an allocation across separate connections or contracts.
Related pages
- Smart charging within the grid connectionSimulate load balancing and smart charging per quarter hour and see how much energy each car gets per session.
- Battery sizing for peak shavingAutomatically calculate the power and capacity needed to stay within your contracted capacity.
- EV charging infrastructureCalculate how many charge points fit within the connection and what smart charging or storage unlocks.
The grid is full.
Show what still fits.
In a demo you see how to get from metering data to a recommendation you can back up. Bring your own data and we look at your case right away.